Note
Go to the end to download the full example code.
Reactors separated by a moving piston#
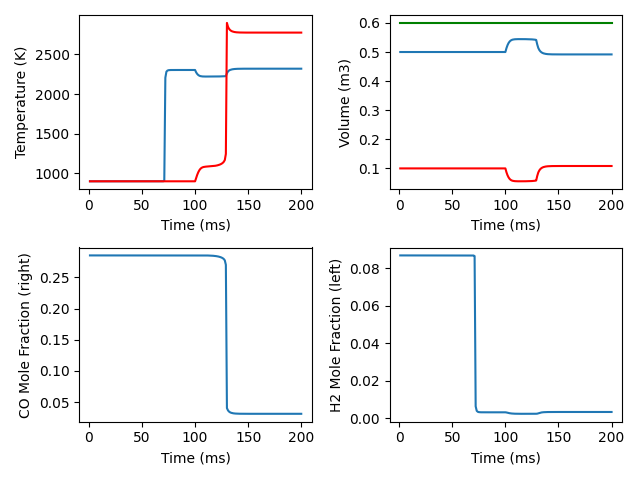
Two reactors separated by a piston that moves with a speed proportional to the pressure difference between the reactors.
Gas 1: a stoichiometric H2/O2/Ar mixture
Gas 2: a wet CO/O2 mixture
-------------------------------------
|          ||                       |
|          ||                       |
|  gas 1   ||        gas 2          |
|          ||                       |
|          ||                       |
-------------------------------------
The two volumes are connected by an adiabatic free piston. The piston speed is proportional to the pressure difference between the two chambers.
Note that each side uses a different reaction mechanism
Requires: cantera >= 3.2.0, matplotlib >= 2.0
import cantera as ct
import matplotlib.pyplot as plt
plt.rcParams['figure.constrained_layout.use'] = True
Create objects representing the gases and reactors
gas1 = ct.Solution('h2o2.yaml')
gas1.TPX = 900.0, ct.one_atm, 'H2:2, O2:1, AR:20'

gas2 = ct.Solution('gri30.yaml')
gas2.TPX = 900.0, ct.one_atm, 'CO:2, H2O:0.01, O2:5'

r1 = ct.IdealGasReactor(gas1)
r1.volume = 0.5
r2 = ct.IdealGasReactor(gas2)
r2.volume = 0.1
The wall is held fixed until t = 0.1 s, then released to allow the pressure to equilibrate.
def v(t):
    if t < 0.1:
        return 0.0
    else:
        return (r1.phase.P - r2.phase.P) * 1e-4

w = ct.Wall(r1, r2, velocity=v)

net = ct.ReactorNet([r1, r2])
Run the simulation and collect the states of each reactor
states1 = ct.SolutionArray(r1.phase, extra=['t', 'volume'])
states2 = ct.SolutionArray(r2.phase, extra=['t', 'volume'])

fmt = '{:10.3f}  {:10.1f}  {:10.4f}  {:10.4g}  {:10.4g}  {:10.4g}  {:10.4g}'
print('{:>10}  {:>10}  {:>10}  {:>10}  {:>10}  {:>10}  {:>10}'.format(
    'time [s]', 'T1 [K]', 'T2 [K]', 'V1 [m^3]', 'V2 [m^3]', 'Vtot [m^3]', 'X(CO)'))
for n in range(200):
    time = (n+1)*0.001
    net.advance(time)
    if n % 4 == 3:
        print(fmt.format(time, r1.T, r2.T, r1.volume, r2.volume,
                         r1.volume + r2.volume, r2.phase['CO'].X[0]))

    states1.append(r1.phase.state, t=1000*time, volume=r1.volume)
    states2.append(r2.phase.state, t=1000*time, volume=r2.volume)
time [s]      T1 [K]      T2 [K]    V1 [m^3]    V2 [m^3]  Vtot [m^3]       X(CO)
   0.004       900.0    900.0015         0.5         0.1         0.6      0.2853
   0.008       900.0    900.0030         0.5         0.1         0.6      0.2853
   0.012       900.0    900.0046         0.5         0.1         0.6      0.2853
   0.016       900.0    900.0062         0.5         0.1         0.6      0.2853
   0.020       900.0    900.0078         0.5         0.1         0.6      0.2853
   0.024       900.0    900.0094         0.5         0.1         0.6      0.2853
   0.028       900.0    900.0111         0.5         0.1         0.6      0.2853
   0.032       900.0    900.0128         0.5         0.1         0.6      0.2853
   0.036       900.0    900.0146         0.5         0.1         0.6      0.2853
   0.040       900.0    900.0163         0.5         0.1         0.6      0.2853
   0.044       900.0    900.0181         0.5         0.1         0.6      0.2853
   0.048       900.0    900.0199         0.5         0.1         0.6      0.2853
   0.052       900.0    900.0218         0.5         0.1         0.6      0.2853
   0.056       900.1    900.0237         0.5         0.1         0.6      0.2853
   0.060       900.1    900.0256         0.5         0.1         0.6      0.2853
   0.064       900.2    900.0276         0.5         0.1         0.6      0.2853
   0.068       900.4    900.0296         0.5         0.1         0.6      0.2853
   0.072      2205.8    900.0316         0.5         0.1         0.6      0.2853
   0.076      2302.0    900.0336         0.5         0.1         0.6      0.2853
   0.080      2303.0    900.0357         0.5         0.1         0.6      0.2853
   0.084      2303.0    900.0378         0.5         0.1         0.6      0.2853
   0.088      2303.0    900.0399         0.5         0.1         0.6      0.2853
   0.092      2303.0    900.0421         0.5         0.1         0.6      0.2853
   0.096      2303.0    900.0443         0.5         0.1         0.6      0.2853
   0.100      2303.0    900.0466         0.5         0.1         0.6      0.2853
   0.104      2231.1   1038.9822      0.5361     0.06393         0.6      0.2853
   0.108      2220.8   1080.2525      0.5434     0.05656         0.6      0.2853
   0.112      2220.4   1086.6947      0.5443     0.05572         0.6      0.2852
   0.116      2220.7   1090.4472      0.5443     0.05571         0.6      0.2849
   0.120      2221.1   1098.0337      0.5441     0.05591         0.6      0.2841
   0.124      2222.0   1114.8905      0.5436     0.05639         0.6      0.2825
   0.128      2224.5   1168.1365      0.5424     0.05764         0.6      0.2774
   0.132      2296.5   2821.8695      0.5066     0.09336         0.6     0.03461
   0.136      2313.6   2784.9365      0.4953      0.1047         0.6     0.03187
   0.140      2317.9   2776.9144      0.4926      0.1074         0.6     0.03128
   0.144      2319.0   2774.9214       0.492       0.108         0.6     0.03114
   0.148      2319.3   2774.4116      0.4918      0.1082         0.6      0.0311
   0.152      2319.3   2774.2803      0.4917      0.1083         0.6     0.03109
   0.156      2319.4   2774.2464      0.4917      0.1083         0.6     0.03109
   0.160      2319.4   2774.2376      0.4917      0.1083         0.6     0.03109
   0.164      2319.4   2774.2354      0.4917      0.1083         0.6     0.03109
   0.168      2319.4   2774.2348      0.4917      0.1083         0.6     0.03109
   0.172      2319.4   2774.2347      0.4917      0.1083         0.6     0.03109
   0.176      2319.4   2774.2346      0.4917      0.1083         0.6     0.03109
   0.180      2319.4   2774.2346      0.4917      0.1083         0.6     0.03109
   0.184      2319.4   2774.2346      0.4917      0.1083         0.6     0.03109
   0.188      2319.4   2774.2346      0.4917      0.1083         0.6     0.03109
   0.192      2319.4   2774.2346      0.4917      0.1083         0.6     0.03109
   0.196      2319.4   2774.2346      0.4917      0.1083         0.6     0.03109
   0.200      2319.4   2774.2346      0.4917      0.1083         0.6     0.03109
Plot the results
fig, ax = plt.subplots(2, 2)
ax[0,0].plot(states1.t, states1.T, '-', states2.t, states2.T, 'r-')
ax[0,0].set(xlabel='Time (ms)', ylabel='Temperature (K)')

ax[0,1].plot(states1.t, states1.volume, '-', states2.t, states2.volume, 'r-',
             states1.t, states1.volume + states2.volume, 'g-')
ax[0,1].set(xlabel='Time (ms)', ylabel='Volume (m3)')

ax[1,0].plot(states2.t, states2('CO').X)
ax[1,0].set(xlabel='Time (ms)', ylabel='CO Mole Fraction (right)')

ax[1,1].plot(states1.t, states1('H2').X)
ax[1,1].set(xlabel='Time (ms)', ylabel='H2 Mole Fraction (left)')
plt.show()

Total running time of the script: (0 minutes 0.802 seconds)

