Note
Go to the end to download the full example code.
Jet-stirred reactor temperature and species profiles#
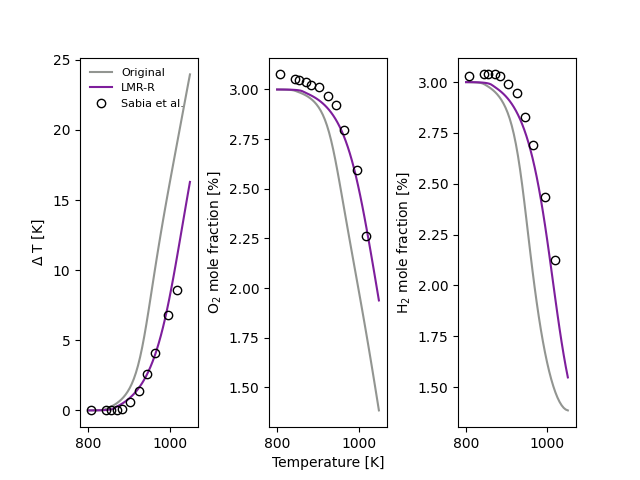
Simulate temperature profiles and species profiles in a jet-stirred reactor across a range of initial temperatures, and observe the impact of incorporating the reduced-pressure linear mixture rule (LMR-R) in such calculations.
Here we will consider a mixture of H2/O2/NH3/Ar (with 10% NH3) at 1.2 atm, and compare results against the experimental measurements of Sabia et al. [1] Two models are compared in this example:
A 2023 model of H2 and NH3 chemistry published by Alzueta et al. [2]
An adapted version of this model that has applied the reduced-pressure linear mixture rule (LMR-R) and ab initio third-body efficiencies. [3]
References:
[1] P. Sabia, M. V. Manna, R. Ragucci, M. de Joannon, Mutual inhibition effect of hydrogen and ammonia in oxidation processes and the role of ammonia as “strong” collider in third-molecular reactions, Int. J. Hydrogen Energy 45 (2020) 32113 – 32127.
[2] M. U. Alzueta, I. Salas, H. Hashemi, P. Glarborg, CO-assisted NH3 oxidation, Combust. Flame 257 (2023) 112438.
[3] P. J. Singal, J. Lee, L. Lei, R. L. Speth, M. P. Burke, Implementation of New Mixture Rules Has a Substantial Impact on Combustion Predictions for H2 and NH3, Proc. Combust. Inst. 40 (2024) 105779.
Requires: cantera >= 3.2, pandas, matplotlib

import numpy as np
import pandas as pd
import time as time
import cantera as ct
import matplotlib.pyplot as plt

f, ax = plt.subplots(1, 3)
plt.subplots_adjust(wspace=0.6)
colors = ["xkcd:grey",'xkcd:purple']
file = 'example_data/ammonia-CO-H2-Alzueta-2023.yaml'
models = {'Original': 'baseline', 'LMR-R': 'linear-Burke'}

inputs = {
    'X': {'H2': 0.03, 'O2': 0.03, 'Ar': 0.846, 'NH3':0.094},
    'T_range': np.linspace(800,1050,50), # [K]
    'Tin': 1000, # reactor temperature [K]
    'P': 1.2, # reactor pressure [atm]
    'tau': 0.5, # residence time [s]
    'V': 0.000113, # reactor volume [m3]
    'K': 2e-5, # 'pressureValveCoefficient'
    't_max': 50,  # [s]
    'h': 79.5, # 'heatTransferCoefficient' [W/m2/K]
    'data': { # experimental data from Sabia et al.
        'T_range': [807,843,855,870,884,904,925,945,965,995,1018],
        'deltaT': [0.051,0.051,0.051,0.051,0.101,0.606,1.414,2.626,4.091,6.768,8.586],
        'X_O2': [3.076,3.053,3.050,3.037,3.024,3.015,2.966,2.924,2.794,2.597,2.261],
        'X_H2': [3.030,3.038,3.038,3.038,3.030,2.993,2.948,2.829,2.693,2.434,2.126]
    }
}

def getStirredReactor(gas,inputs):
    reactorRadius = (inputs['V']*3/4/np.pi)**(1/3) # [m3]
    reactorSurfaceArea =4*np.pi*reactorRadius**2 # [m3]
    fuelAirMixtureTank = ct.Reservoir(gas)
    exhaust = ct.Reservoir(gas)
    env = ct.Reservoir(gas)
    reactor = ct.IdealGasReactor(gas, energy='on', volume=inputs['V'])
    ct.MassFlowController(upstream=fuelAirMixtureTank,
                          downstream=reactor,
                          mdot=reactor.mass/inputs['tau'])
    ct.Valve(upstream=reactor,
             downstream=exhaust,
             K=inputs['K'])
    ct.Wall(reactor, env, A=reactorSurfaceArea, U=inputs['h'])
    return reactor

def getTemperatureDependence(gas, inputs):
    stirredReactor = getStirredReactor(gas,inputs)
    columnNames = (
        ['pressure'] +
        [stirredReactor.component_name(item)
         for item in range(stirredReactor.n_vars)]
    )
    tempDependence = pd.DataFrame(columns=columnNames)
    for T in inputs['T_range']:
        gas.TPX = T, inputs['P']*ct.one_atm, inputs['X']
        stirredReactor = getStirredReactor(gas,inputs)
        reactorNetwork = ct.ReactorNet([stirredReactor])
        t = 0
        while t < inputs['t_max']:
            t = reactorNetwork.step()
        state = np.hstack([stirredReactor.phase.P,
                        stirredReactor.mass,
                        stirredReactor.volume,
                        stirredReactor.T,
                        stirredReactor.phase.X])
        tempDependence.loc[T] = state
    return tempDependence

for k,m in enumerate(models):
    gas = ct.Solution(file, name=models[m])
    gas.TPX = inputs['Tin'], inputs['P']*ct.one_atm, inputs['X']
    tempDependence = getTemperatureDependence(gas,inputs)
    ax[0].plot(tempDependence.index,
               np.subtract(tempDependence['temperature'],tempDependence.index),
               color=colors[k],label=m)
    ax[1].plot(tempDependence.index, tempDependence['O2']*100, color=colors[k])
    ax[2].plot(tempDependence.index, tempDependence['H2']*100, color=colors[k])
ax[0].plot(inputs['data']['T_range'], inputs['data']['deltaT'], 'o', fillstyle='none',
           color='k', label="Sabia et al.")
ax[1].plot(inputs['data']['T_range'], inputs['data']['X_O2'], 'o', fillstyle='none',
           color='k')
ax[2].plot(inputs['data']['T_range'], inputs['data']['X_H2'], 'o', fillstyle='none',
           color='k')
ax[0].legend(fontsize=8,frameon=False,loc='upper left')
ax[0].set_ylabel(r'$\Delta$ T [K]')
ax[1].set_xlabel(r'Temperature [K]')
ax[1].set_ylabel(r'O$_2$ mole fraction [%]')
ax[2].set_ylabel(r'H$_2$ mole fraction [%]')
ax[0].set_xlim([780,1070])
ax[1].set_xlim([780,1070])
ax[2].set_xlim([780,1070])
plt.show()
Total running time of the script: (0 minutes 8.933 seconds)

